


In a world increasingly shaped by liquidity cycles, few charts have gained as much cult-like status as the “Global M2 Money Supply” overlay popularised by macro legends Raoul Pal and Julian Bitel. At first glance, it’s just a colourful visual mapping global broad money supply against Bitcoin’s price action. But to the trained eye—and seasoned…
In a world increasingly shaped by liquidity cycles, few charts have gained as much cult-like status as the “Global M2 Money Supply” overlay popularised by macro legends Raoul Pal and Julian Bitel. At first glance, it’s just a colourful visual mapping global broad money supply against Bitcoin’s price action. But to the trained eye—and seasoned crypto bulls—it’s a roadmap. A prophetic one. One that might now be screaming: “Bitcoin could hit $300,000 in 2025.”
Welcome to what they call the Banana Zone.
What Is the Banana Zone?
The term was coined semi-jokingly by Pal in the midst of the 2020–2021 bull run, due to the chart’s distinct upward arc resembling a banana. But behind the name is serious macroeconomics.
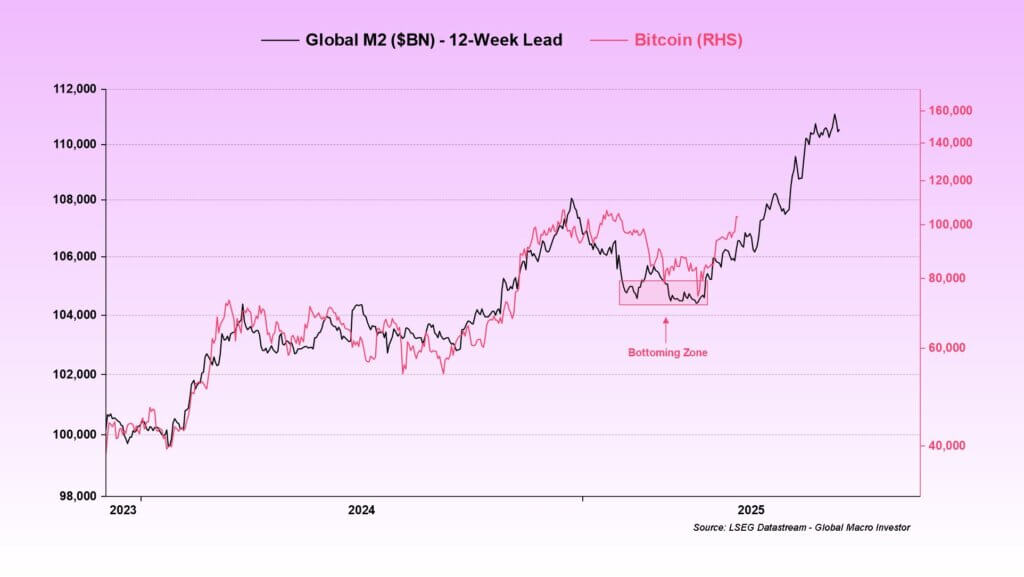
The Global M2 Money Supply—a measure of global liquidity including cash, checking deposits, and easily convertible near money—has historically had a strong correlation with Bitcoin price action. This is because when liquidity expands, capital seeks yield and risk assets like Bitcoin typically outperform.
In crypto lingo, the Banana Zone is when “everything goes up.” Bitcoin surges. Altcoins explode. NFTs reappear. Memecoins go parabolic. Retail investors flood in, and institutional capital ramps up exposure. It’s a euphoric acceleration phase where fundamentals matter less than flows, and the only question is: How high can we go before the music stops?
The M2 Money Supply Signal: Bullish on Steroids
Let’s break down the chart everyone’s watching.
Since late 2022, global M2 liquidity has been steadily expanding again. The U.S., Japan, China, and Europe have all loosened financial conditions in various forms—either through interest rate cuts, credit easing, or quantitative operations. This infusion of money into the system is being mirrored in Pal’s updated Banana Zone projections, with the latest model suggesting:
- Bitcoin could reach between $250,000 to $300,000 by late 2025
- Ethereum and altcoins would also follow similar banana-shaped parabolic trajectories
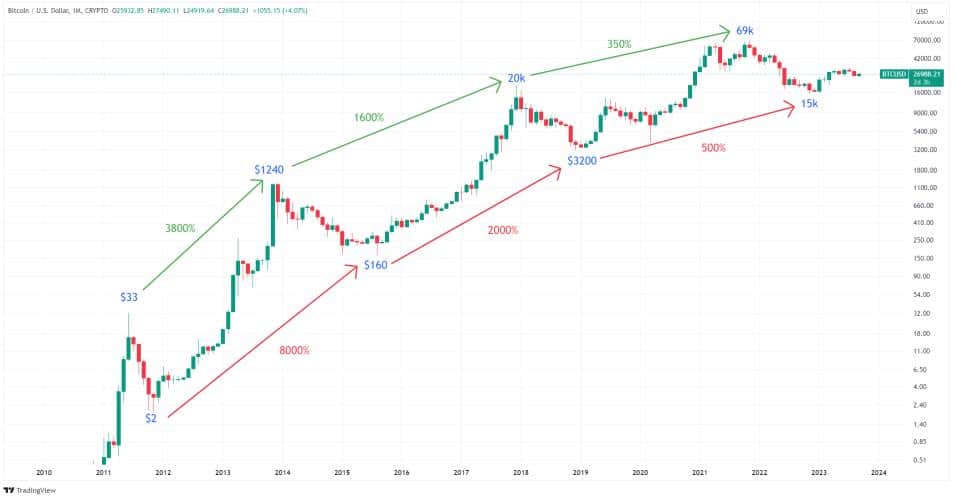
This isn’t blind speculation. In both 2017 and 2021, Pal’s overlay of Bitcoin against global M2 expansion mapped price action with uncanny precision. The lag between liquidity growth and Bitcoin surging has often been 6–9 months, meaning we’re now in the sweet spot.
Macro Liquidity Is Back – And So Is Bitcoin
As of July 2025:
- The Global M2 Money Supply has reached a new record high
- U.S. Federal Reserve is signalling cuts by Q4
- ECB and Bank of Japan continue to pursue expansionary policy
- Emerging markets are injecting capital to maintain GDP growth
Bitcoin, in turn, has breached $100,000, nearly doubling in the past year. This matches the timing in previous cycles where the crypto market began its vertical leg up.
Check out: UAE CRYPTO: THE FUTURE OF FINANCE
Why $300,000 Is More Than Just Hopium
1. Institutional Flows Are Maturing
The introduction of spot Bitcoin ETFs across the U.S., Europe, and Asia has transformed access to BTC. BlackRock’s iShares Bitcoin Trust alone now holds over $20 billion in assets under management, according to its Q2 filings.
2. Sovereign Accumulation
Countries like El Salvador, Bhutan, and, more recently, Argentina have ramped up BTC reserves. Some are even mining Bitcoin to strengthen sovereign balance sheets.
3. Halving Tailwinds
Bitcoin’s last halving occurred in April 2024. Historically, this event sets off a 12–18-month bull cycle. The current timing fits perfectly with that pattern, aligning with M2 expansion.
4. Scarcity Meets Demand
With over 90% of Bitcoin mined, and long-term holders refusing to sell, the float is shrinking. Combine that with rising institutional demand, and you have a perfect supply squeeze.
5. The Banana Zone: Last Stage Euphoria
Pal argues that we’ve now entered the final acceleration phase, where Bitcoin no longer moves in steps — it moves in leaps.
The Banana Zone Isn’t Just About Price
This phase is marked by:
- Narrative euphoria (think AI x Blockchain, DePIN, RWAs)
- Retail re-entry and TikTok influencers back on the grind
- Meme coins reaching billion-dollar valuations overnight
- NFTs being declared dead, then booming again
- Alt undefined chains promising a “Solana 2.0” revolution
In essence, the Banana Zone brings not just price explosions, but a whole cultural reawakening in crypto.

Counterpoints: What Could Go Wrong?
While the Banana Zone offers upside beyond imagination, it isn’t without risk.
1. Liquidity Reversal
If inflation resurges or recession hits, central banks could reverse course. That would drain M2 and kill the rally.
2. Regulatory Pressure
A global regulatory crackdown could stall institutional momentum.
3. Market Exhaustion
Every parabolic cycle ends. If price runs too far too fast, a blow-off top could leave many stranded.
Still, most analysts agree: We’re not there yet. The market has not reached peak euphoria. There’s room to run.
Final Word: Don’t Miss the Banana
Whether you’re a hardened Bitcoin maxi, a DeFi degenerate, or a normie dabbling through an ETF, 2025 might be the year Bitcoin enters the stratosphere. The data, the macro trends, and the cycle timing all line up.
And if Raoul Pal is right — and history rhymes — then this Banana Zone might deliver a $300,000 Bitcoin before the music stops.
Wen Banana?
The Banana Zone refers to a parabolic phase in the Bitcoin 4-year cycle when global M2 money supply is rapidly expanding, leading to explosive rallies across crypto assets.
Historically, Bitcoin’s price action has closely followed global M2 expansion with a 6–9 month lag, making it one of the most reliable macro indicators for predicting crypto bull runs.
Yes, analysts like Raoul Pal argue that based on current liquidity trends, ETF inflows, and historical cycle data, Bitcoin could plausibly reach $250,000–$300,000 during the final leg of the current bull run.
Key risks include unexpected monetary tightening, regulatory crackdowns, or a premature market blow-off top that could halt the rally before reaching those highs.


