


A new wave of data-driven analysis has the crypto world buzzing — and it’s not built on hype. Economist Timothy Peterson has released hundreds of quantitative simulations suggesting that Bitcoin (BTC) has a 50% chance of hitting $140,000 by the end of October. A Bitcoin $140K prediction is surely welcomed by everyone holding coins. According…
A new wave of data-driven analysis has the crypto world buzzing — and it’s not built on hype. Economist Timothy Peterson has released hundreds of quantitative simulations suggesting that Bitcoin (BTC) has a 50% chance of hitting $140,000 by the end of October. A Bitcoin $140K prediction is surely welcomed by everyone holding coins.
According to Peterson’s probability model, based on a decade of daily Bitcoin price data, this month could mirror the cryptocurrency’s historically strong October performance — where average gains exceed 20%.
A Data-Backed Forecast, Not Emotion
Peterson’s forecast, shared on X (formerly Twitter), claims that Bitcoin’s path toward $140,000 is rooted in statistics, not sentiment.
“There is a 50% chance Bitcoin finishes the month above $140k,” he wrote, adding that there is also a “43% chance Bitcoin finishes below $136k.”
The model uses Bitcoin’s daily price movements since 2015 to simulate thousands of possible outcomes. Each simulation follows the same logic, reflecting the coin’s repetitive volatility and cyclical rhythm.
“It’s a probability-based projection derived purely from data — not human emotion or biased opinion,” Peterson explained.
Bitcoin’s October Momentum
Bitcoin started October at around $116,500 and briefly reached a new all-time high of $126,200 earlier this week, according to CoinMarketCap. As of writing, BTC trades near $122,000, meaning it would need to climb roughly 14.7% to hit the $140K mark.
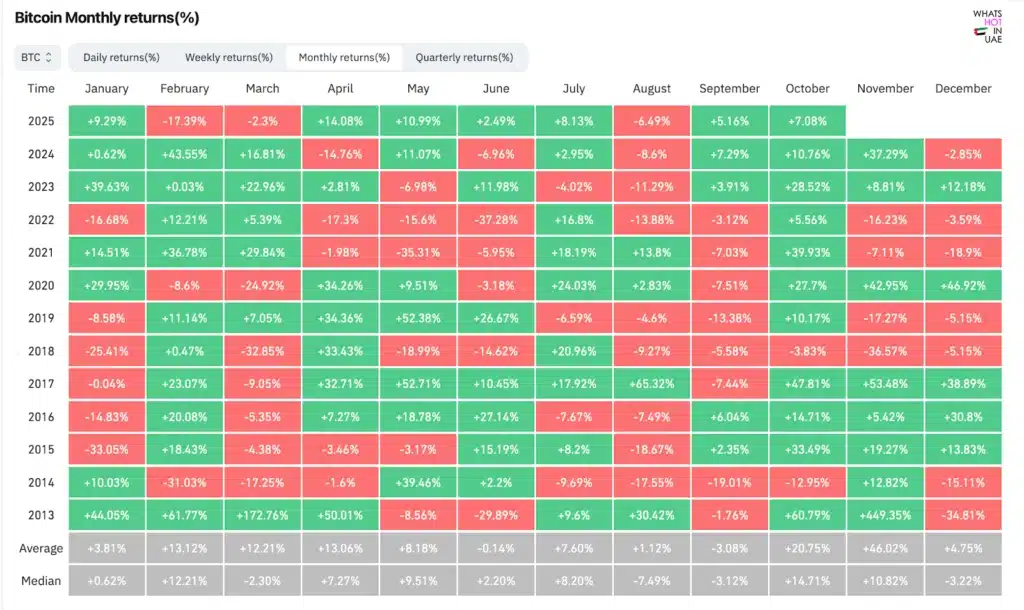
That kind of rise is not far-fetched for October. Historically, the month has been Bitcoin’s second-best performer after November. Data from CoinGlass shows that Bitcoin’s average October gain since 2013 is 20.75%, which would put Peterson’s forecast almost exactly in line with long-term averages.
Peterson said his results suggest “half of Bitcoin’s October gains may have already happened,” meaning the current consolidation could precede another push upward later in the month.
Why October Matters in Crypto Cycles
While technical analysts often debate support and resistance zones, Peterson’s model looks at liquidity, sentiment, and cyclical institutional activity.
“Markets are not random in the short term,” he said. “They are cyclical in liquidity, sentiment, and positioning. October is historically significant because it marks the turn of institutional capital cycles.”
The timing aligns with Q3 portfolio rebalancing, fiscal year planning, and year-end performance reviews among major funds. These cycles often increase Bitcoin’s demand as institutions reposition for the final quarter.
Volatility Still a Risk
Despite the positive probabilities, history shows Bitcoin doesn’t always obey its own trends. In several years, it has deviated sharply from expected models, either under-delivering or over-shooting by double-digit margins.
The crypto market’s 24/7 structure, combined with macroeconomic shocks and liquidity constraints, can cause outlier events that no simulation fully predicts.
Peterson’s analysis aims to clarify that probabilities are not guarantees but statistical likelihoods.
“The result is a clear, probability-based picture of where Bitcoin’s value is most likely to go,” he said.
Other Analysts Stay Bullish
Peterson’s simulation aligns with a growing chorus of bullish voices. After Bitcoin’s new high of $126,200 earlier this week, several analysts forecast continued upside.
Crypto trader Jelle told followers that Bitcoin is retesting key highs:
“It’s definitely over for bears. Send it higher,” he wrote on X.
Similarly, Matthew Hyland commented that “the pressure is building” as BTC consolidates near its record zone.
Market sentiment remains overwhelmingly optimistic, fuelled by ETF inflows, institutional positioning, and expectations of lower interest rates heading into 2026.

Probability vs. Psychology
What makes Peterson’s forecast stand out is its attempt to quantify Bitcoin’s emotional market behaviour.
Most short-term price predictions rely on social sentiment or technical chart patterns. His simulation removes that bias, replacing human instinct with repeatable data logic.
That approach provides what traders crave most — clarity amid chaos. In a market where hype and fear dominate, a 50% mathematical chance offers a rare anchor of rationality.
Bitcoin’s Historical October Performance
- 2013: +60%
- 2017: +47% (Pre-bull run surge)
- 2020: +28% (Institutional buying wave)
- 2021: +40% (ETF optimism)
- 2022: −5% (Bear market contraction)
- 2023: +23% (Halving cycle anticipation)
If the trend holds, a rise of around 20% would bring BTC close to $140,000, almost perfectly matching Peterson’s median forecast.

Market Implications if Bitcoin Hits $140K
If Bitcoin closes October near or above $140K, it would mark another all-time high and further cement its narrative as a deflationary hedge.
Such a rally could trigger:
- Renewed institutional FOMO (fear of missing out)
- Increased media coverage, drawing retail investors back in
- A short squeeze for bearish traders betting against BTC
- Stronger altcoin correlation spikes, pushing up Ethereum and Solana
It would also strengthen the case for early 2026 bull-run momentum as halving effects deepen.
The Bigger Picture
Whether or not Bitcoin hits $140K this month, Peterson’s simulation reinforces one key point: the asset’s market rhythm is not random.
Over 10 years of data show that Bitcoin follows recognisable patterns in liquidity and sentiment, often amplified during October’s historically strong period.
As volatility continues to define crypto, models like this offer an anchor — not a prophecy, but a pattern worth watching.
An economist known for data-driven crypto models that forecast Bitcoin trends using statistical simulations.
A 50% probability that BTC closes the month above $140,000, based on 10 years of historical data.
They are probability-based, not guarantees — Bitcoin often diverges from historical trends due to external market forces.
Historically, October delivers average gains of 20% or more as institutional cycles and capital inflows increase before year-end.


